About Deducer
Why Deducer?
Deducer is designed to be a free easy-to-use alternative to proprietary data analysis software such as SPSS, JMP, and Minitab. It has a menu system to perform common data manipulation and analysis tasks, and an excel-like spreadsheet in which to view and edit data frames. The goal of the project is two fold.
- Provide an intuitive graphical user interface (GUI) for R, encouraging non-technical users to learn and perform analyses without programming getting in their way. So it may lower the entry threshold.
- Increase the efficiency of expert R users when performing common tasks by replacing hundreds of keystrokes with a few mouse clicks. Also, as much as possible the GUI should not get in their way if they just want to do some programming.
Why Not?
- Deducer is java-dependend and therefore sometimes not stable (although it has been a long time since I had problems, but I work very rarely with the deducer package; maybe it is more stable these days)
- R is designed for text based interactions, the full functionality is not available through menus
- the course will be based on typing the commands but maybe the Deducer GUI helps to overcome your inhibition to use R
Installation
there are instructions how to install at http://www.deducer.org/
Windows: the all-in-one installer for windows will install an outdated R version, so please install first a recent R version from CRAN Windows
install the java development toolkit from here: http://www.oracle.com/technetwork/java/javase/downloads/jdk8-downloads-2133151.html
- start R and run
1 install.packages(c("Deducer","DeducerExtras"))
- start Deducer from within R:
- run R
- type: library(JGR)
- followed by: JGR()
- there is also a script created during the installation; the path is shown when you start Deducer via R (e.g. \texttt{~/R/i686-pc-linux-gnu-library/2.14/JGR/scripts/run}
Prepare
- After you have installed deducer, you have to load the Deducer related packages (this extends the menus)
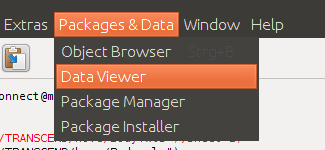
go to the packages & data menu in the menu bar

choose Package Manager
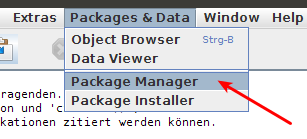
- the package manager opens up:
by marking the checkboxes in the first column you can load packages (loaded)
by marking the ckeckboxes in the second column you can choose which packages you want to be automatically loaded every time you start Deducer (default)
- the third and fourth columns show the name and a short description of the packages respectively
scroll down to the Deducer and the DeducerExtra packages and mark for each of them both: the loaded and the default checkbox
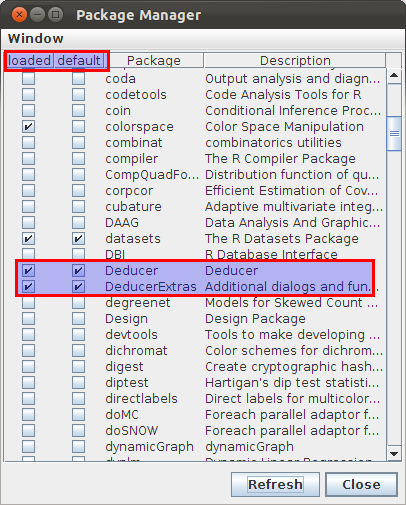
close the package manager by clicking on the Close button
- Now basic statistical procedures are available through the menus (and from now on in every session)
First Steps
- now we will test some functionalities
- so first we load an examples data set:
go to the Extras menu in the menu bar and choose Load data from package
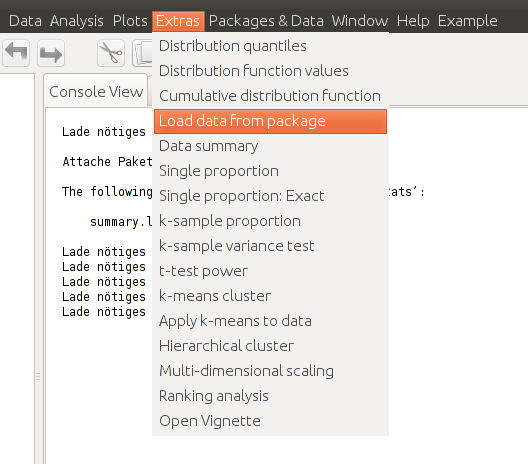
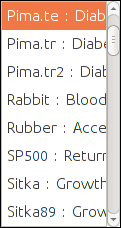
- a little window opens up and you can choose a data set
for now choose the Pima.te data set and click the Run button
Open the Data Viewer
The data viewer provides an easy to use, spreadsheet-like environment to view and edit data. Copy and pasting is supported, and is compatible with Excel 2003/2007, so data can be moved from Excel to R by simply copying it to the data viewer. Contextual menus are used to insert, delete and copy rows and columns.
The Data Viewer - Data View
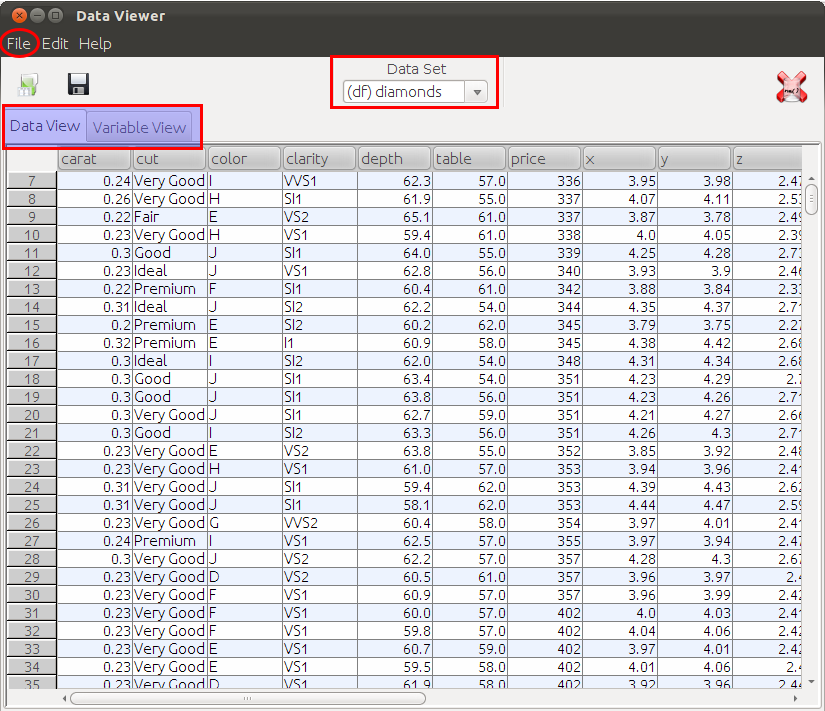
- a right click on the row or column headers
- allows one to insert, copy and delete columns and rows \note{Add column sex}
- sort by one column
- you can also edit the data
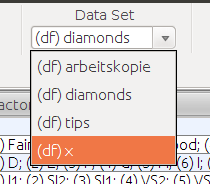
- in the drop down menu Data Set you can choose the data frame
The Data Viewer - Variable View
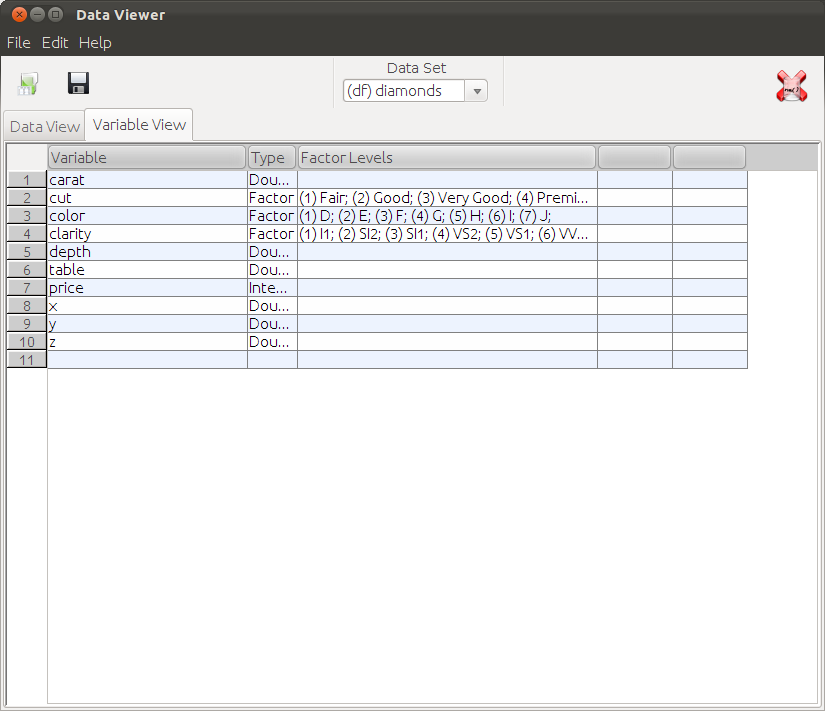
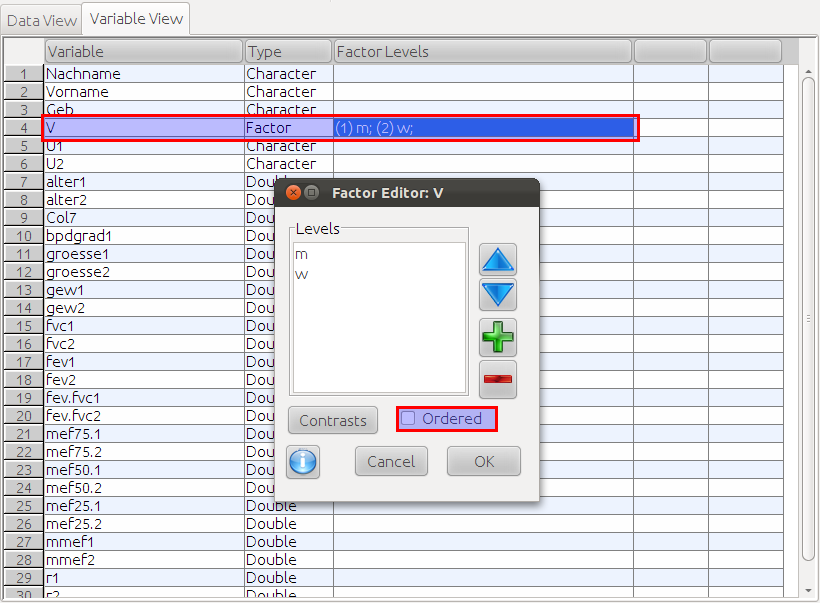
In the variable view The variable column represents the variable name. The type column determines the storage type.
- the properties of each variable in the data frame can be edited
- the type column determines the storage type; variables can be stored as
- Strings (character)
- Doubles (Numeric)
- Integers
- Logicals (yes/no) or
- Factors
- The levels of Factors are displayed in the 'Factor Levels' column, and can be edited by clicking on the appropriate cell, which brings up the Factor Editor
The levels of Factors are displayed in the 'Factor Levels' column, and can be edited by clicking on the appropriate cell, which brings up the Factor Editor.
Exercise
Find and load the MASS package (via the Packages & Data menu).
- Load the Pima.te data (if you haven't done it already)
Some Basic Descriptives
Tables
now go to the Analysis menu from the menu bar and choose Frequencies
a little window will show up, make sure that in the upper left corner you have chosen the Pima.te data set
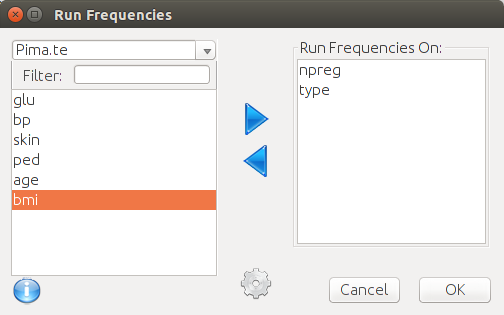
- the left half of the window shows all available variables
choose npreg (number of pregnancies) and type and transfer them to the righthandside
now click the ok button
- what we get is a table containing the absolute frequencies, the relative frequencies and the cumulative frequencies
Numeric Summaries
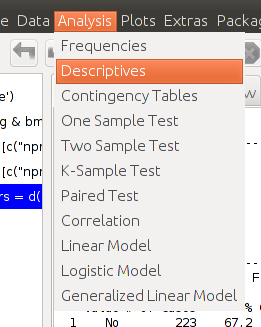
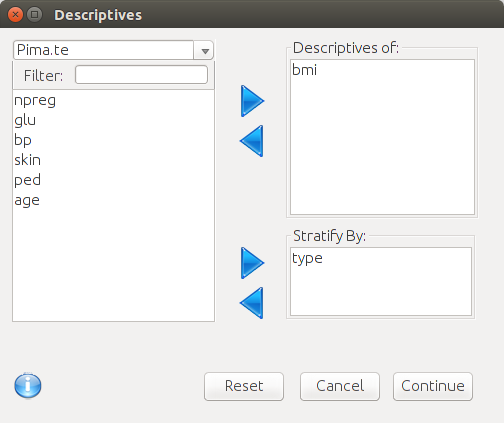
now go to the Analysis menu from the menu bar and choose Descriptives
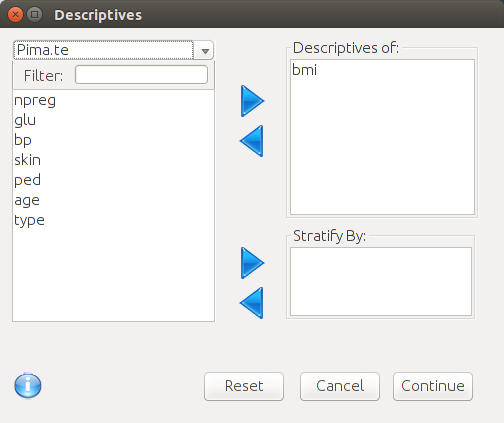
again a little window will show up, make sure that in the upper left corner you have chosen the Pima.te data set
- the left half of the window shows all available variables
choose bmi
now click the ok button
- now we get a window where you can choose the summary statistics you are interested in
- you may choose the mean, the standard deviation, and the number of valid n
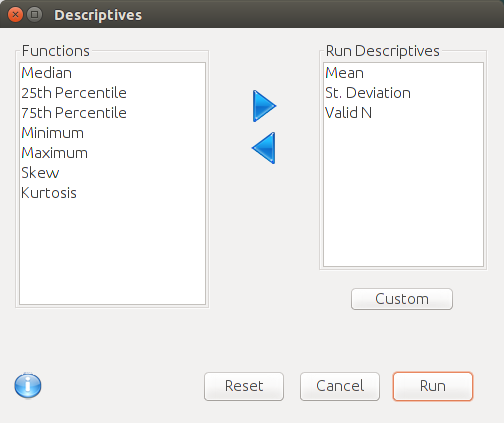
- press the run button and you get the results
Exercises
- use the steps above to get the mean, median, the 25th percentile and the 75th percentile of the bmi variable
do the same again but now use the Strata box in the second (with variable type). Is there a difference regarding to those summary statistics between the groups?
Exercises for RStudio Users
- instead to do the steps via the menus, now we use the keyboard
- so load the MASS package by typing
1 library(MASS)
load the Pima.te data by typing
1 data(Pima.te)
- get information about the frequencies of npreg type
1 table(Pima.te$npreg)
1 prop.table(table(Pima.te$npreg))
- do the same with the type variable
- use the summary command to get basic information about the distribution of the the bmi variable
1 summary(Pima.te$bmi)
